DVP1960
New member
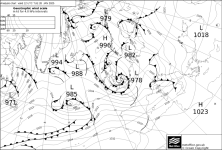
I understand how to see cold, warm and occluded fronts on the surface analysis charts.
However, I am confused by the simple, often short thick black lines seen on the British met office charts. I think they are fronts but what are they and what is their effect.
I guess that this is pretty basic stuff, but I cannot find the answer on the internet.
View attachment 7
However, I am confused by the simple, often short thick black lines seen on the British met office charts. I think they are fronts but what are they and what is their effect.
I guess that this is pretty basic stuff, but I cannot find the answer on the internet.
View attachment 7